School Liaison Officer Program - Appendix
APPENDIX
The following data tables present the results of all closed-ended survey questions, disaggregated by staff and students, for schools within the Vancouver School Board district (excluding independent schools). The sample includes 613 students and 156 staff. Note that not all students and staff answer each survey question, and therefore, the total number of respondents for each question varies. There are no significant differences between the findings for VSB schools, and the findings presented in the overall report. Most of the differences in observed values presented here fall within the margin of error for the total sample (+/- 4.0%). There are only a few notable differences, including that Southeast Asians are somewhat less represented in this VSB sample (11% vs. 16% in the total sample), and students in the VSB sample had more positive views of police (58% vs. 51% in the total sample). This appendix disaggregates the closed-ended survey results to isolate responses from schools within the VSB district, distinguishing them from non-VSB school responses included in the overall report.
Table 3. Demographics of School Staff and Students Surveyed, VSB Schools[1]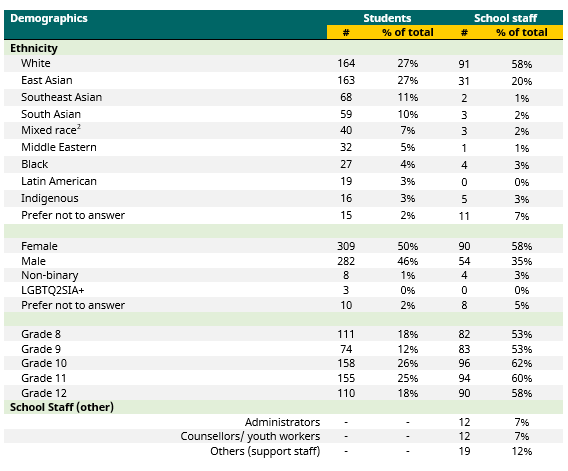 Teachers can teach more than one grade; some totals may not sum to 100% due to rounding
Table 4. SLO Program Change Addressed Concerns, VSB Sta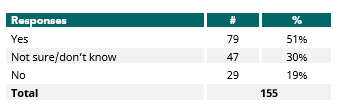 Source: School Staff Survey, 2025
1. Please note that the total number of participants reporting on various demographic indicators varies across indicators.
2. 4 students identified as mixed Indigenous and other ethnicities Note. Table and figure numbering is based on the subsequent table in the final report
Note. Table and figure numbering is based on the subsequent table in the final report
Figure 2. Ever Interacted With an SLO, VSB Schools
Questions: Have you interacted with an SLO?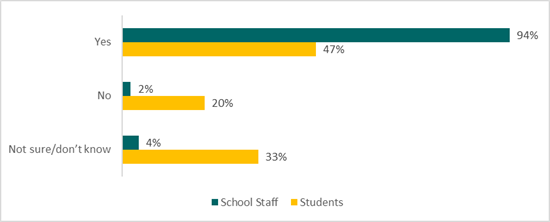 Source: School Staff and Students Survey, 2025
Table 5. VSB Staff Interactions with SLO Officers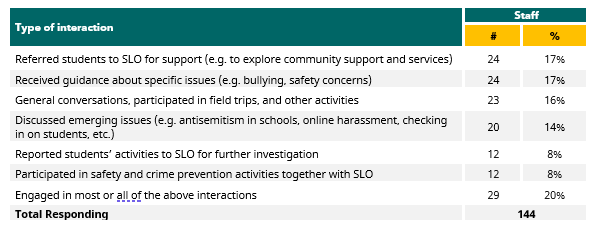 Source: School Staff Survey, 2025
Table 6. VSB Students Interactions with SLO Officers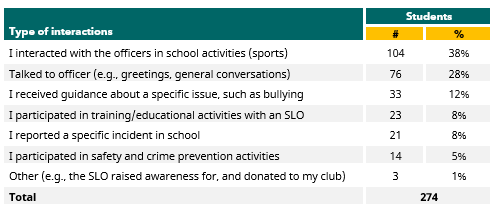 Source: Students Survey, 2025
Figure 3. Level of Familiarity with the SLO Program, VSB Schools
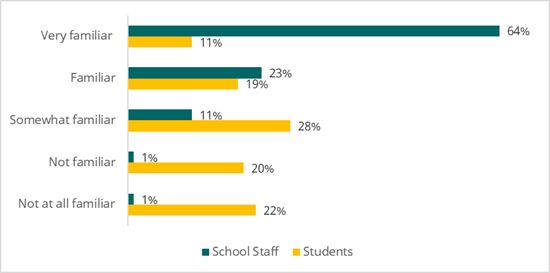 Source: School Staff and Students Survey, 2025
Figure 5. Comfort in Approaching SLO for Guidance and Advice, VSB Students
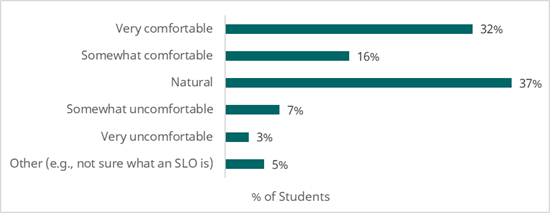 Source: Students Survey, 2025
Figure 6. Profile of Students who Reported Being Uncomfortable Approaching SLO, VSB Students
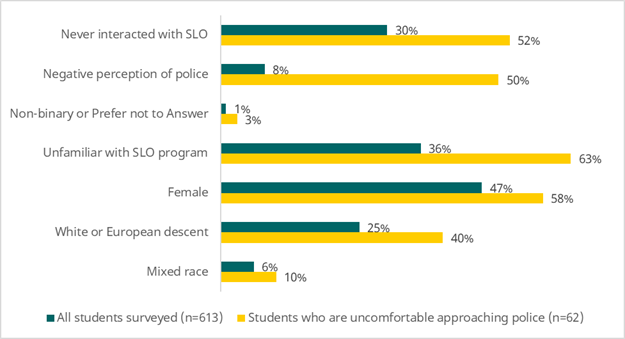 Source: School Staff and Students Survey, 2025
Figure 7. SLOs Contribute to a Sense of Safety in Schools, VSB Schools
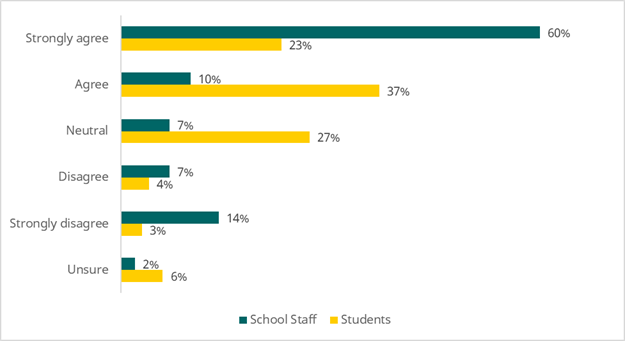 Source: School Staff and Students Survey, 2025
Figure 8. SLOs Contribute to a Sense of Positive Community in Schools, VSB Schools
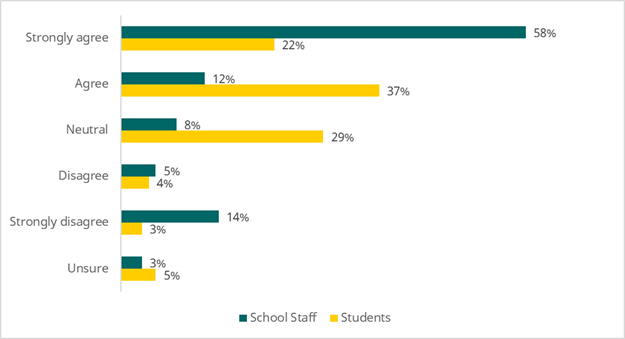 Source: School Staff and Students Survey, 2025
Figure 9. Proportion Of Students Over Time Who Feel Negatively about SLOs' Impact on School Safety, VSB Schools[3]
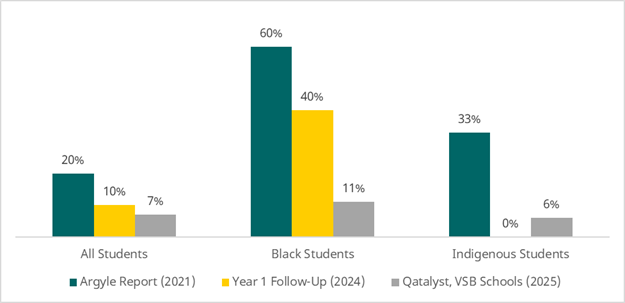 Sources: Argyle Report (2021), Year 1 Follow-Up Review (2024), Qatalyst Student Survey (2025)
Figure 10. Proportion of Students Over Time who Feel Negatively about SLO Contribution to a Sense of Positive School Community, VSB Schools[4]
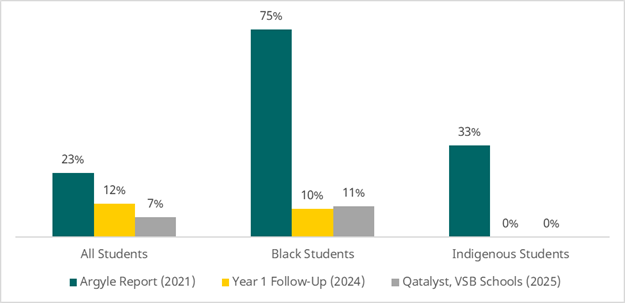 Sources: Argyle Report (2021), Year 1 Follow-Up Review (2024), Qatalyst Student Survey (2025)
Figure 11. Students and Staff Level of Support for SLO, VSB Schools
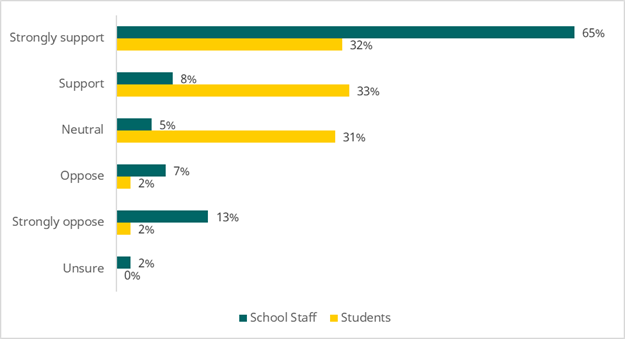 Source: School Staff and Students Survey, 2025
Figure 12. Students and Staff Perceptions of Police, VSB Schools
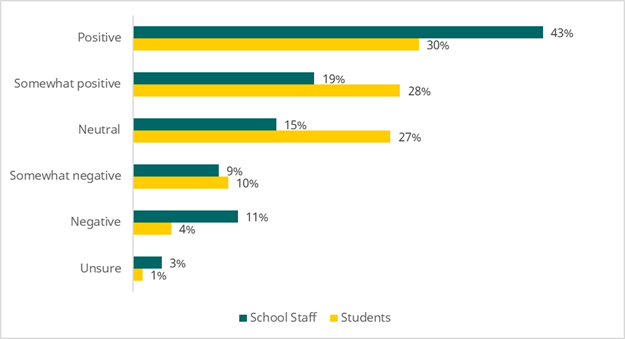 Source: School Staff and Students Survey, 2025
Figure 13. SLOs Impact on Perceptions of the Police, VSB Schools
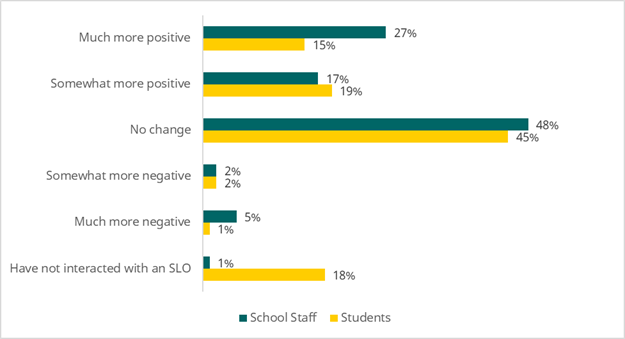 Source: School Staff and Students Survey, 2025 Note. Blank responses are removed from the calculation
[1] Please note that the total number of participants reporting on various demographic indicators varies across indicators.
[2] 4 students identified as mixed Indigenous and other ethnicities
[3] Students were asked to rank their agreement with the following statement “I think the SLO program contributes to a sense of safety in my school”, on a scale of 1 to 5 where 1 – Strongly Disagree, 3 – Neutral, and 5 – Strongly Agree
[4] Students were asked to rank their agreement with the following statement “I think the SLO program contributes to a sense of positive community in my school”, on a scale of 1 to 5 where 1 – Strongly Disagree, 3 – Neutral, and 5 – Strongly Agree